(Last updated: 12/17/2025 | PERSONAL OPINION)
Since I left SAS Institute, the enterprise advanced analytical software vendor, I have worked in two analytics and AI/ML heavy shops, both are in the process of digitizing their services and both view data, analytics and AI as the core enabler. The size, industry, culture and approach of the two could not be more different, yet their wants and needs for the D’s and A’s (DnA) couldn’t be more similar. Hence, I’m tempted to generalize from my sample of two here. But to begin with, let me make it clear what do I mean by DnA:
- The D‘s
- Digital
- Data
- The A‘s
- AI
- Analytics
- Automation
- Application
- AI Aided Analytics
- Augmented AI
- …
One important thing to note is that the D’s and A’s are just means.
Enterprise
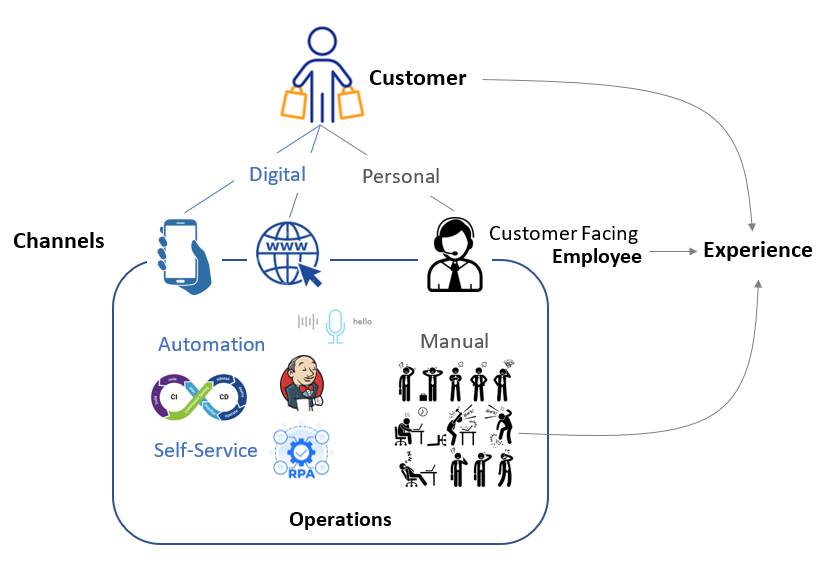
Enterprise is a hodgepodge of dichotomies which if you don’t be clear-minded about them you’re assured to get lost in them:
- External vs Internal.
- Customer vs Employee.
- Experience vs Operations.
- External or internal, customer or employee, wherever there are people, there is the concern of experience.
- Digital vs Personal.
- Digital is almost always present alongside what’s considered personal engagement. A phone call with a customer service representative (CSR) is personal but the CSR is aided by a myriad of digital solutions to better and more efficiently serve the customer.
- Automation vs Manual, and the self-service which is in between.
- Experience or operations, Digitization is the prerequisite of automation.
Digital
Digital means “no face-to-face human interactions in the loop“. You might immediately object to my definition with edge cases but by and large it’s correct I believe:
- I submitted a self-service ticket over the web. It’s been triaged by one person, approved by another and carried out by yet another human. Since I never have to deal with them face-to-face, it’s a digital experience from my point of view.
- I walked into a Whole Foods store at 7:00AM when it’s literally empty. After picking out one loaf of bread, five apples and two oranges, I self-checked out and left the store at 7:14AM.
- The payment portion of my experience was clearly digital.
- Even though I never encounter a human, the rest of my experience can not be categorized as either digital or personal
- Maybe we need to add a third category, “Physical“, to cover the case? Physical means interactions with objects
When it comes to implementation, Digital is built up on top of several kinds of technologies:
- Information Technology (IT 1), digitizing the physical world into 0’s and 1’s.
- Social Technology, enabling a group of people getting things done.
- Use case review
- Group chat
- Managerial Technology.
- Accounting of cost, profit and loss
- Continuous process improvement process such as Lean Six Sigma
- Intellectual Technology (IT 2), making sense of the digitized world.
- Analytics, Data ⇒ Insights ⇒ (Manual) Decision ⇒ (Manual) Action.
- AI, Data ⇒ Model ⇒ (Automatic) Decision ⇒ Automation.
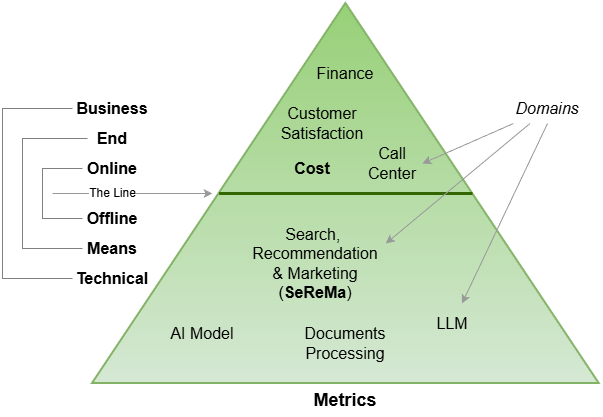
The Customer Experience Flywheel
Your customers are not all alike. Some are born digital, some still rely on snail mail. Some do day trading, many sleep on their 401-K. Some come to you, some refuse to pick up the phone when reached out. Some are your competitors’ customers, some are nobody’s customers… Outbound, inbound, search, recommendation, marketing (SeReMa)… You need to employ all means and channels to provide your customers with the insanely good experiences they deserve!
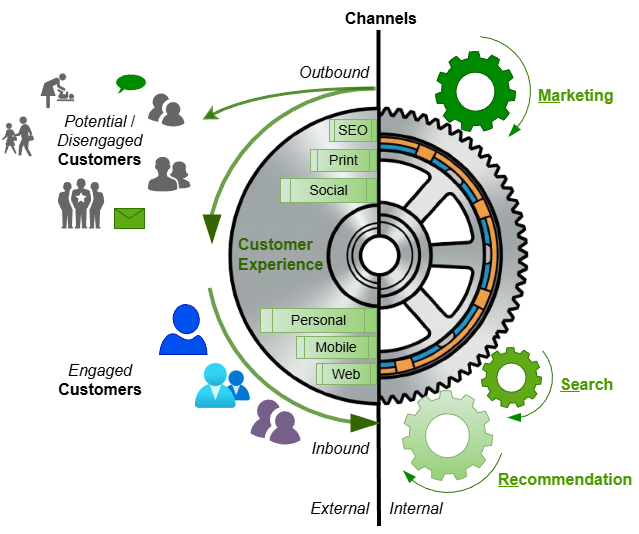
A sucessful experiential flywheel employs all available channels and technologies:
- Search and Recommendation rely on AI
- Marketing relies on analytics
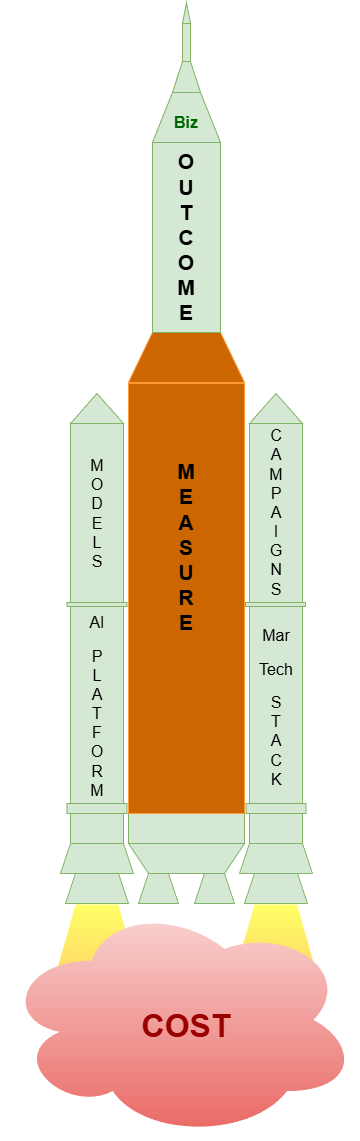
The Business Value Rocket
It goes without saying that good customer experience leads to great business value, but:
- How do we know X is good and Y is great?
- We need to define metrics and measure!
- How can we make X better and Y greater?
- We need to understand drivers of experience and outcome with causal analytics
- We need to conduct experimentations to trail-n-error
Data
The field of data is so mature and commoditized that it tends to escape my attention. Not anymore with the advent of generative AI.
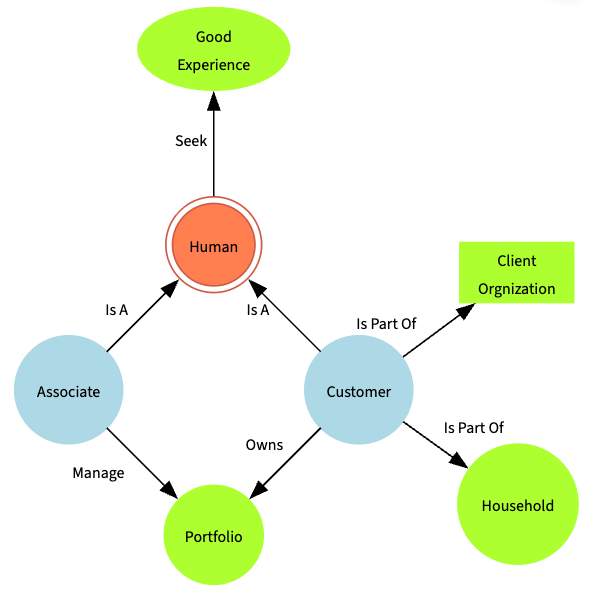
Ontology
While data dimensions make sense to humans, they don’t make sense to machines (AI). What’s missing are what’s between the words as humans read them. For example, customer and associate to machines are just two distinct labels, no different than apple and fish which is another pair of distinct labels. But to humans, we fill in the background knowledge between the two concepts represented by the labels:
- We know both are humans.
- We know one is internal while the other is largely external to your firm.
- We know both seek good experiences as both are humans.
- …
Concepts plus the relationships among them constitutes an ontology. One possible ontology for the sample dimensions above would looks like blow:
Semantic Data
Data are semantic when machines may “understand” them like humans do. It’s the tall order Semantic Web set out to achieve in 2001. While it failed at web-scale adoption, countless technologies and ideas developed along the way which are ripe for enterprise scale exploitation:
- Ontology. Tools for creating ontologies.
- RDF. The subject-predicate-object triplets knowledge representation.
- RDF Schema. Data modeling abstractions for RDF data. It defines the structure of RDF data.
- OWL. The Web Ontology Language which allows for formally defined meaning, i.e., semantics.
- JOSN-LD. The less verbose and more readable incarnation of RDF with JSON.
- Reasoning.
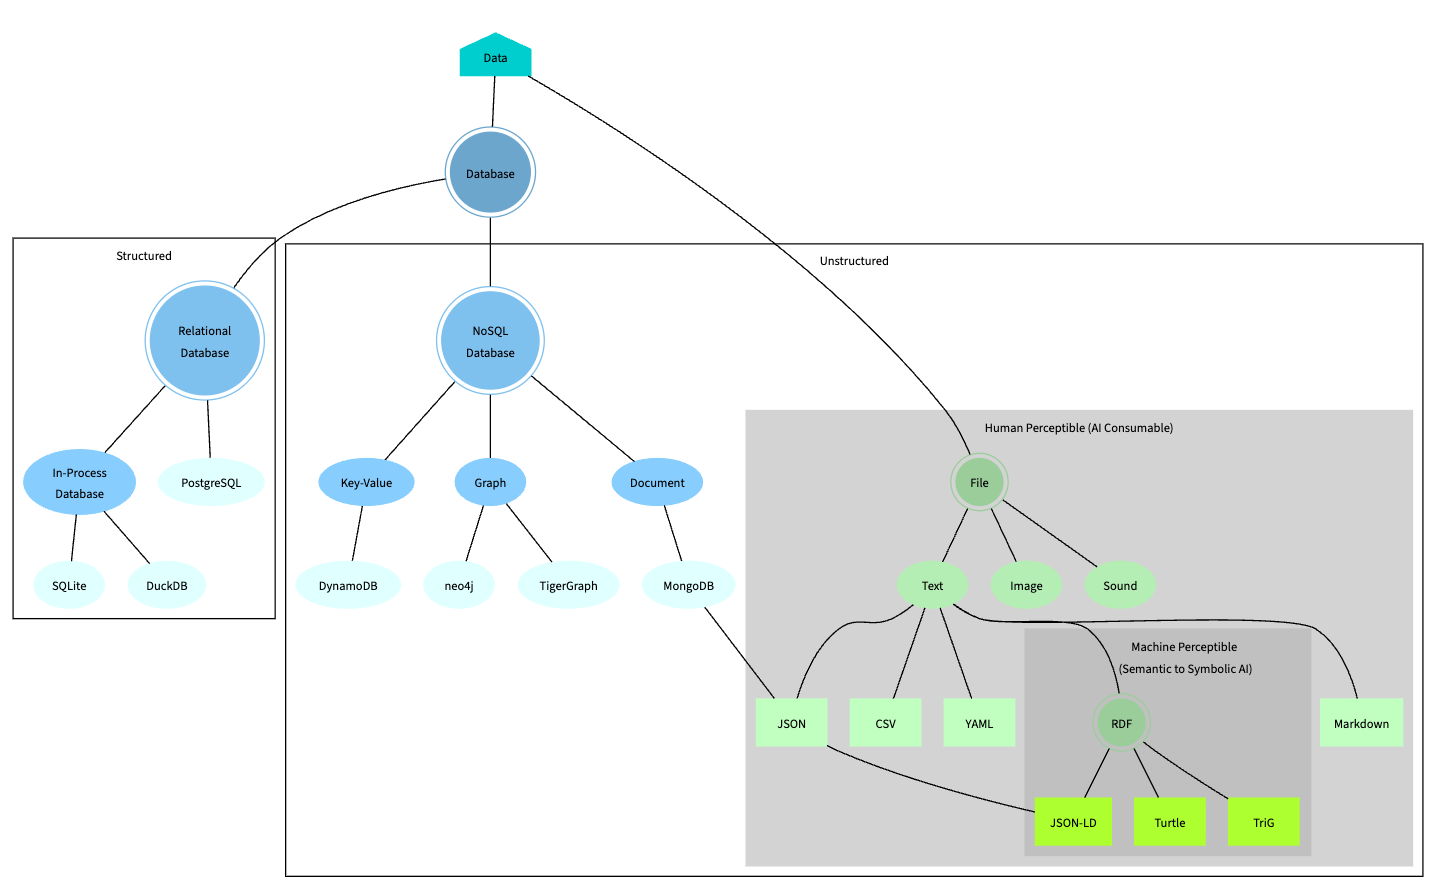
AI Consumable Data
Because they’re trained on human-perceptible data, current generation of AI can only consume human-perceptible data. Data hidden away in all form of databases are out of reach to AI, unless they’re exposed by MCP, which is based on JSON, a human-perceptible text format. As more evidences of AI’s human-perceptible data requirement:
- Claude Subagents are stored as Markdown files with YAML frontmatter
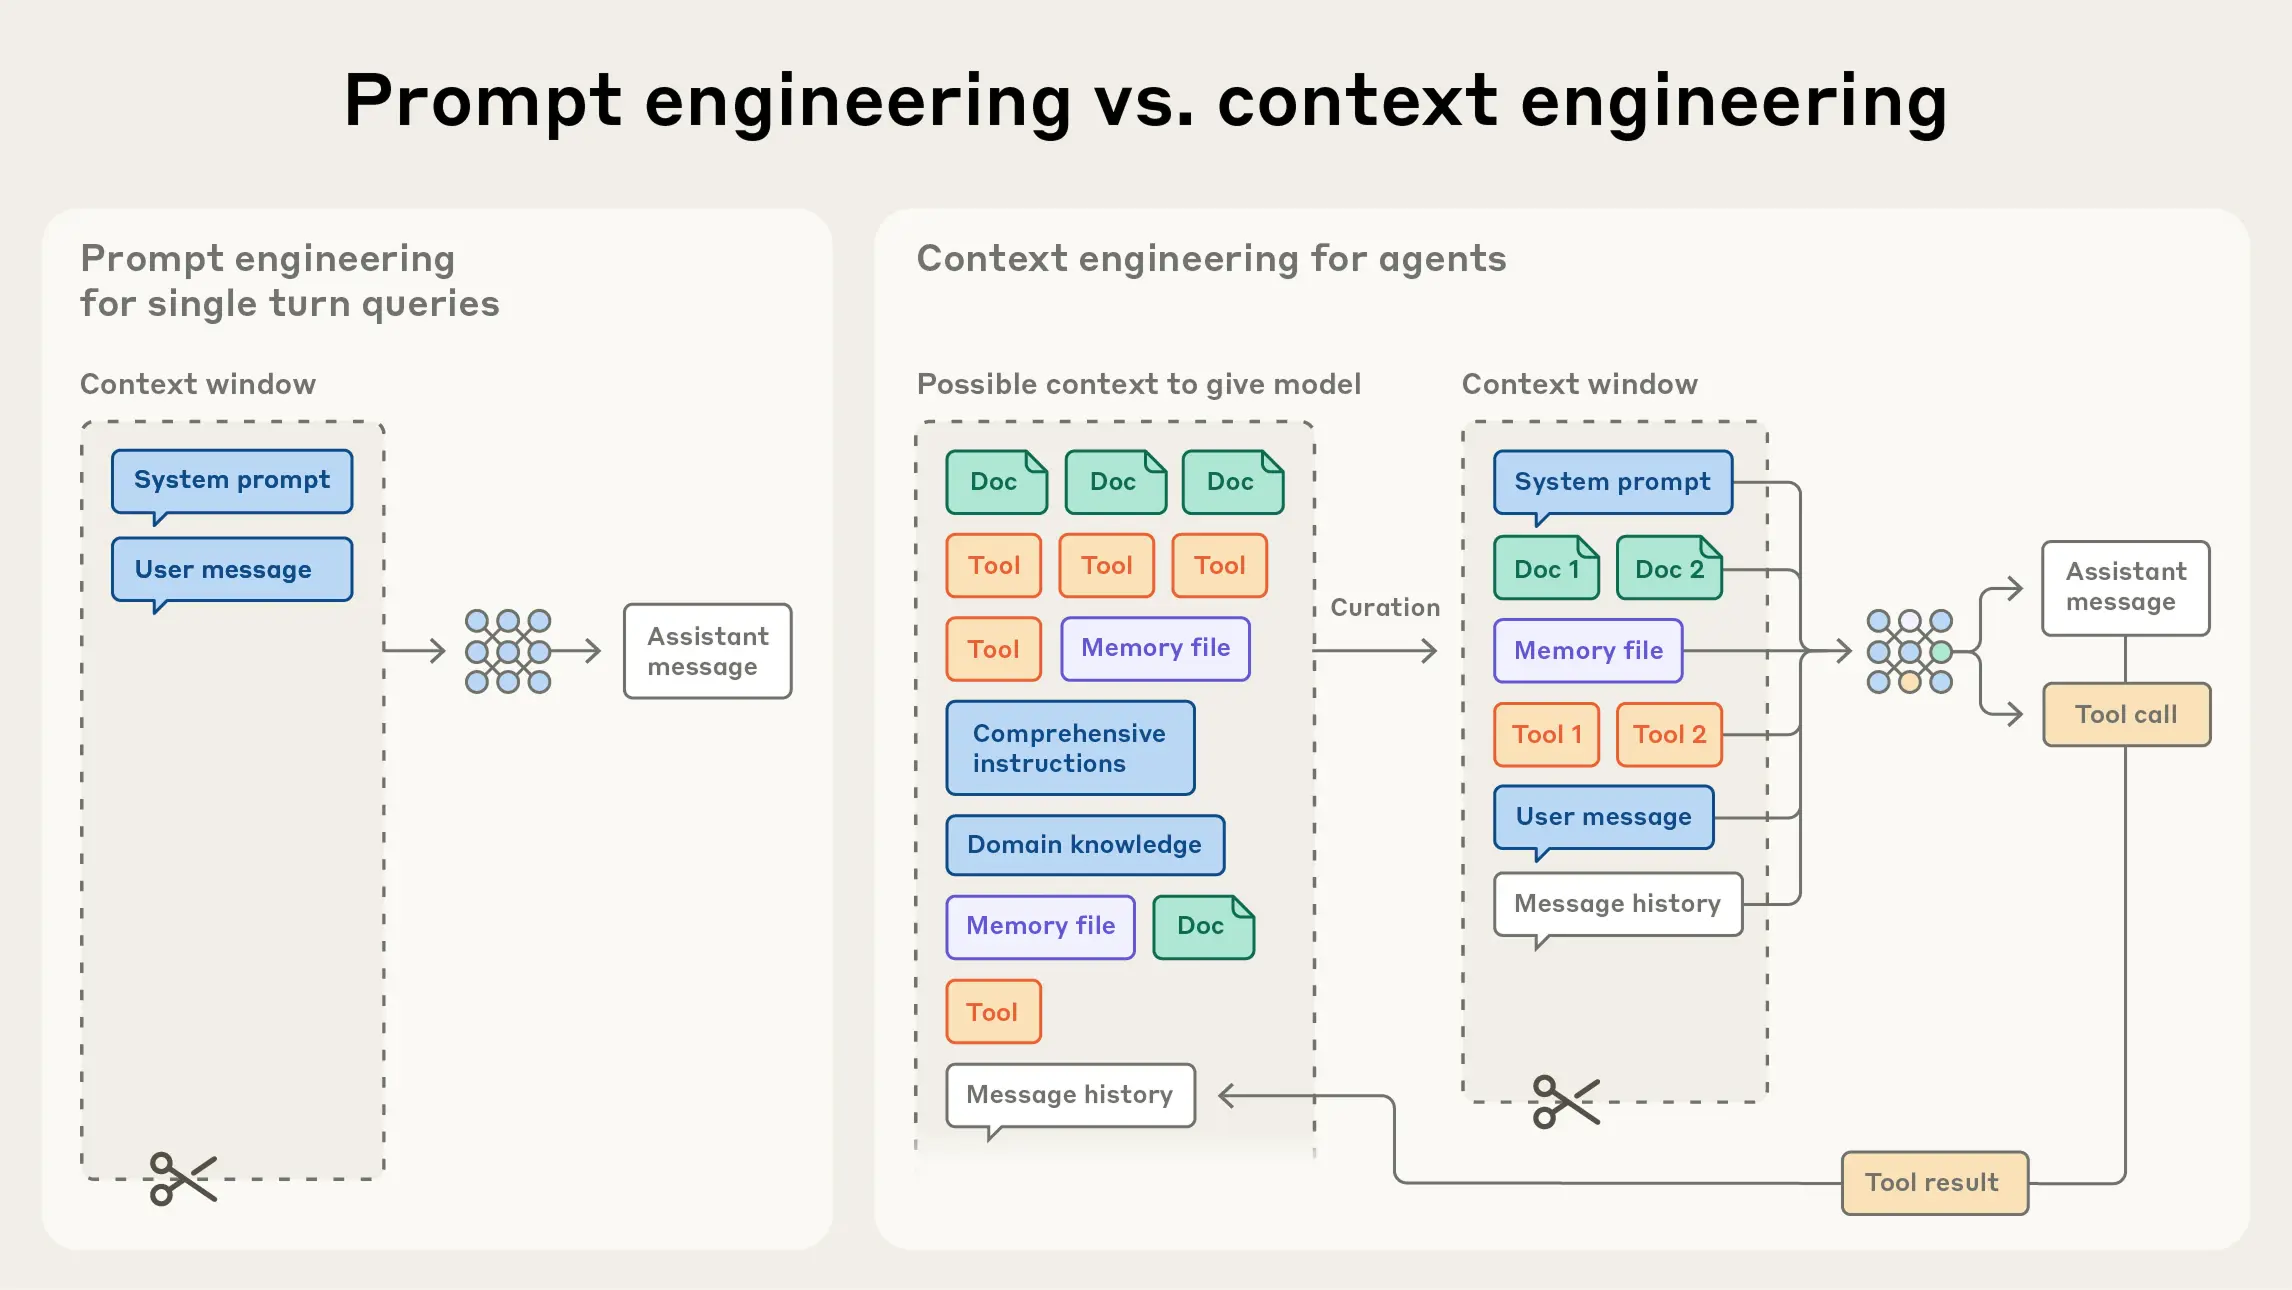
- Documents feature prominently as the main ingredient of Context Engineering
Click on the image to see the full-sized version and click “Back” button of your browser to go back to this page.
The data community is faced with a new challenge in the era of Generative AI, that is, how to keep dual formats of the same data, one optimized for efficiency of storage and query while the other for context engineering geared toward AI consumption? My two cents:
- Move contents out of proprietary data store into flat files.
- Put a MCP layer in front of the data stores to expose the data therein to LLMs
- Possibly keep two copies of same data:
- One in database for efficient storage and query
- One in files for AI consumption
- Alternatively one copy in database + a lazy exporter for AI consumption
Metrics
Metrics are special kind of data, most of the time derived data that measures efficacy and business outcomes.
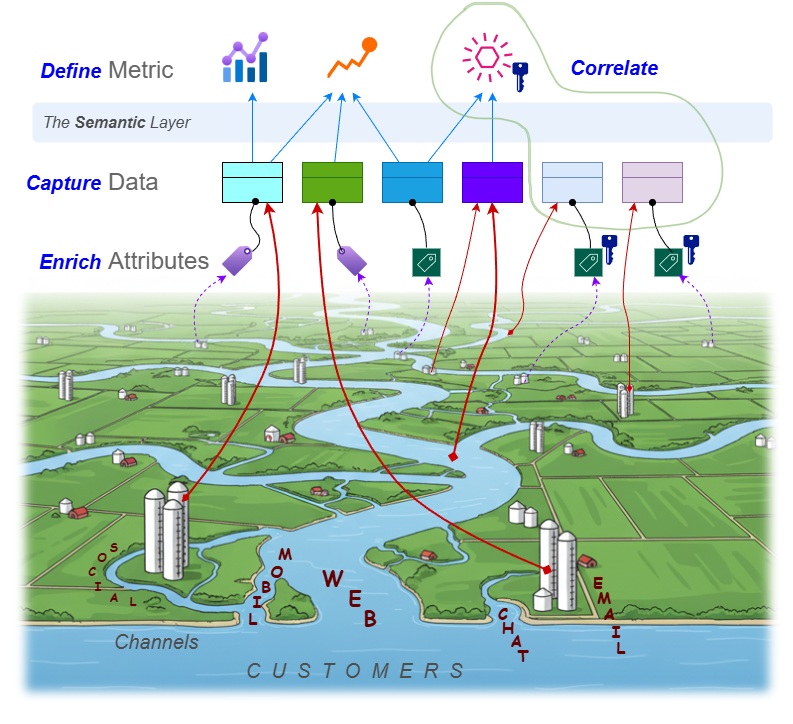
The Measurement Process
Regardless the purpose (outcome vs cost), modalities (structured, stream, graph…) and sources (web, mobile, chat, social…), the same measurement process applies: define, capture, enrich and correlate:
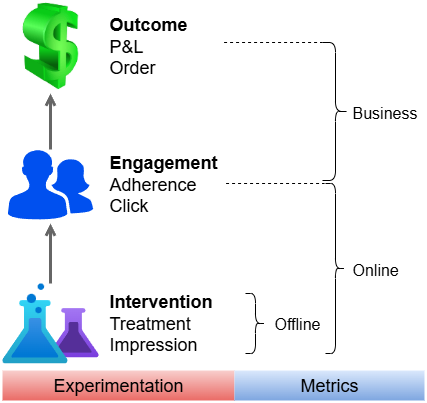
The Measurement Spaces
Measurement is tightly tied to experimentation, which happens in both contexts of AI and Marketing, as well as different setups:
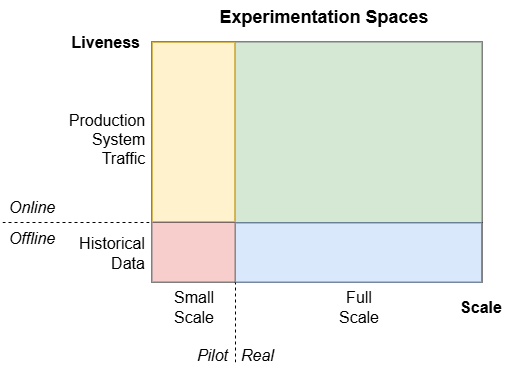
Some examples of offline and online metrics:
Outcome vs Engagement vs Intervention
Although business outcomes should ideally be favorably affected by user interventions, to get closer to the truth, they should be defined, measured and analyzed independently without the knowledge of interventions. Customers as the conduit between the two are the ultimate force field warper that makes the path from intervention to outcome a dynamic and unpredictable one. The only way out is to measure, measureand measure!
- Many interventions with good offline metrics perform poorly online with real customers.
- Good online metrics not necessarily be able to move bottom line business outcomes.
Some examples of the three in different domains are listed below:
| Healthcare | Advertisement | Financial Services | |
|---|---|---|---|
| Intervention | Prescribed medications | Display ads to users | AI generated answers to customer question |
| Engagement | Does the patient take the medications? | Does the user click the ad? | Does the rep use the AI generated answers? |
| Outcome | Patients healthier? | User place order? | Reps handle more customer calls? More customer satisfaction? |
Outcome vs Benchmark
Benchmarks which are metrics derived from artificial, offline, sampled and idealized “realities” should not be trusted blindly. Outcomes, on the other hand, ugly maybe but is real:
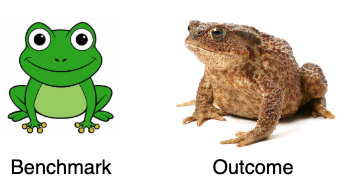
Business owners who have the wisdom to demand for and the courage to face the real outcomes should be praised effusively. Because only in them lies the hope of improving on the outcomes.
Integrated DnA
Like the K-12 grades of school, the separation of the D’s and A’s in enterprises are arbitrary, contrived and harmful.
Tower of Babel
For those unfamiliar with the biblical story of the Tower of Babel, a united human race speaking a single language agree to build a great city with a tower that would reach the sky. God, witnessing and weary of humanity’s power in unity, confounds their speech so that they can no longer understand each other and scatters them around the world, leaving the tower unfinished.

While the perils of human hubris and irreverence are not lost on us, the moral of the Tower of Babel story readily applies to enterprise DnA Practice which should strive for the oneness:
- One Structure. There should be one tower in one city, not many towers around the many cities around the world. The Tower of Babel is not the best structure? Contribute to and improve it!
- One Function. For Tower of Babel the function is to reach the sky. For enterprise DnA practice it’s to realize business values. All the D’s and A’s endeavors should be measured and judged by this single criteria.
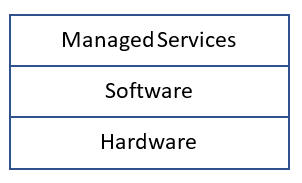
The shape of the tower may vary for different enterprises but the basic structure is the same:
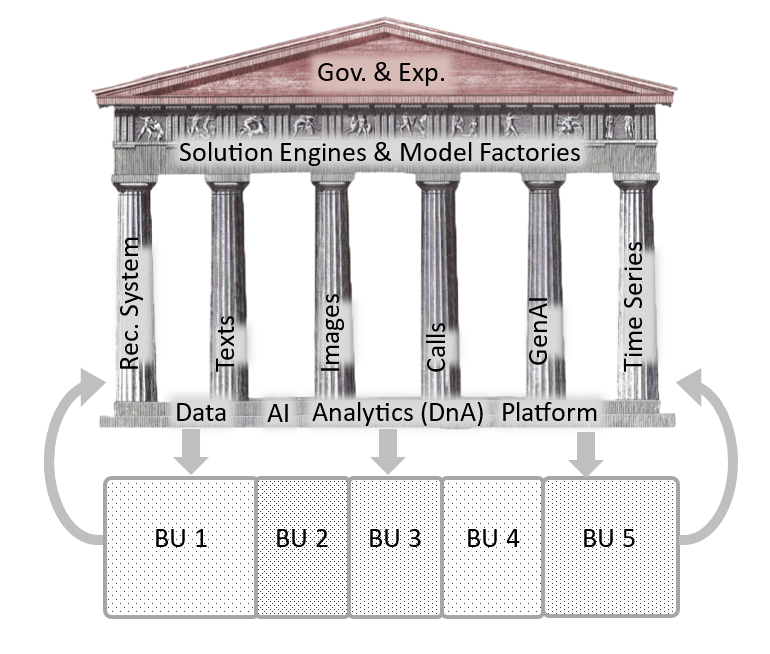
Regardless of the role one play in the D’s and A’s, we’re all minions working together perfecting the DnA Tower bit by bit:
As the data, analytics and AI platform builders
We dream to erect a tower
A tower that’s tall enough
to be visible from every corner
A tower that prominently displays
the common, the core and the force multipliers
A tower where worthy work has its designated place
and informative info fed to different stakeholders
A place where actions are performed and things get done
all within the insanely good experience layer
Grounds, figure and heads
Focusing on the engineering of the D’s and the A’s, the body of work can be anatomized as three distinct groups:
- The Ground. 0 and 1’s, the data, artifacts and their storage.
- The Figure. Consist of three main subsystems:
- The Skeletons. The structural system: CPU, GPU, distributed inference… The compute.
- The Veins. The circulatory system: ETL, the semantic layer, measurements capturing… The data pipelines and flows.
- The Organs. The functional system: App Maker, Model Maker, GenAI Gateway… The tools, engines, products and solutions.
- The Heads. Tableau for dashboards, Fiddler for model monitoring, Adobe Target for A/B testing, interactive web apps for demoing… various visualization and experience heads.
- Many heads are figureheads in the sense that they’re so commoditized that they can be replaced with ease. Tableau, PowerBI or any other new dashboarding heads can be switched relatively easily compared with the underlying storage, compute and data ETL pipelines that power them.

Note for the multiple heads corresponding to different sub-domains such as analytics, experimentation and AI, there is only one figure. Because, data, storage, compute and flow alike, there are natural synergies to share across sub-domains:
- The same model inference capturing pipeline can serve the needs of multiple heads such as Fiddler the model performance monitoring head, the model online training head, the legal risk compliance (LRC) audit head, as well as the model outcome analysis head.
- The same business metrics defined in the semantic layer can serve both the Tableau dashboarding head as well as the AI model training head.
- The same automation, eventing and work-flowing substrates can be rationalized and reused across sub-domains.
- The same UI framework and frontend dev resources can be shared in building different user experiences in different sub-domains.
The DNA Platform
With digitization comes the overabundance of data, which enables and necessitate the line of work of analytics and insights generation. When data comes in too fast and too much, human driven analytics must be aided by or cede to model driven AI/ML.
Every digitized enterprise needs data, analytics and AI/ML, is there a general architecture that applies to all?
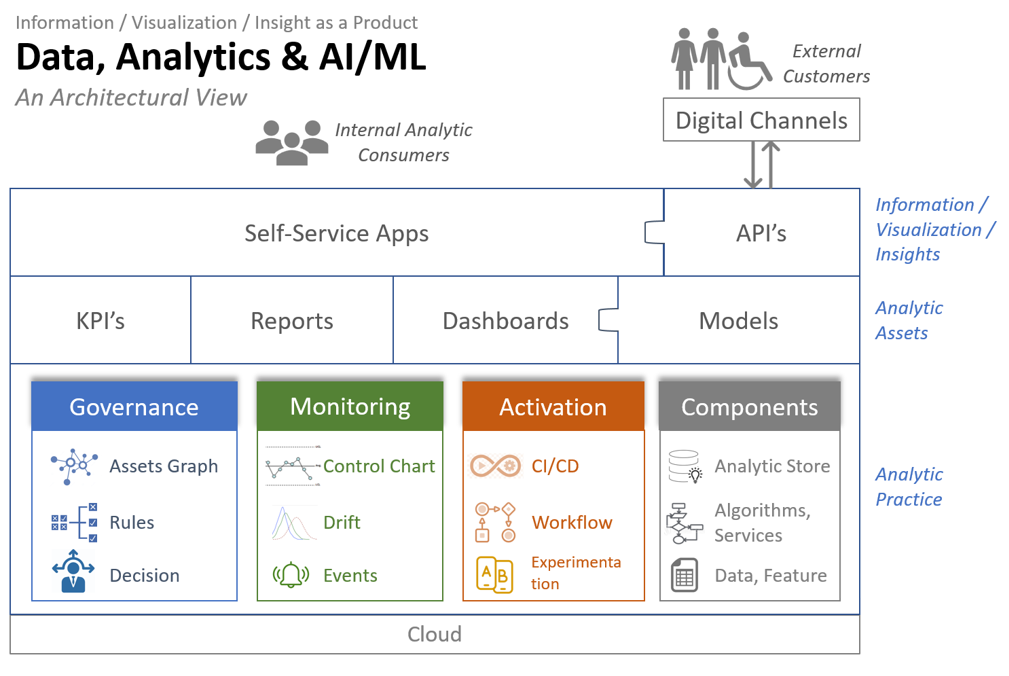
Assets
Metrics, KPI’s, reports, dashboards and models are the typical analytic assets an enterprise use to help improve business processes. Their formats range from numbers to tables to texts to visualizations, and their nature range from descriptive to predictive to prescriptive.
Delivery
“Self-service” is the most wanted feature asked for by internal business partners. Instead of getting a static image depicting a specific configuration, business partners want interactive visualization app with which they can conduct exploratory and investigative study of their own, by tweaking the configurations and generating visualizations on the fly. Same idea applies to other type of assets as well as the underlying data. They want mechanism which enable them to obtain data or produce assets by themselves.
For non-human consumers, such as web/mobile apps, API is THE way to serve analytical insights.
Practice
What differentiate one enterprise from others is its analytic practice to produce and deliver analytic assets. Is the KPI calculated once a year in Excel by a business analyst, or is it produced automatically daily by a pipeline and feed into a control chart which monitors, alerts and triggers appropriate actions?
Without analytic practice, an enterprise can still produce various analytic assets, though it cannot scale up the pace and quality of assets produced.
Governance
Governance is not about compliance and policing, as most enterprises approach it today, rather it’s about decisioning in aim of effective management and use of assets.
As the foundation of good governance is the assets graph: taxonomy, ontology, lineage, catalogue, glossaries… Tools that capture the semantics of things as well as the relationship among things.
Once the assets graph is in place, a dynamic layer can be built on top: alerts that capture exceptions, rules that prescribe how to handle things and ultimately decision workflows with complex logic.
The semantic layer models the environment in which analytics operates and the dynamic layer on top ensures the alignment between business processes and objectives.
Monitoring
Monitoring is the nerve system of an enterprise’s analytic function: Events captures the raw sensory signals. Alerts/Messages triages events based on semantics and rules. Control charts exert statistical process control over KPI’s…
Activation
There are different levels of activation corresponding to different roles in the analytics ecosystem: at the lower level, CI/CD enables data engineer and data scientists commit and deploy their changes to data pipelines or models; One level up, inference workflows produce insights on schedule or triggered by events; On the top level, business partners and consumers consumes insights via self-service apps or API’s.
Whether it’s the data engineers running unit test, or the data scientist tuning model parameters or the outcome researchers doing A/B testing, experimentation is a crucial step before activation.
Components
A proven mechanism to deploy and run batch models, an efficient way of windowing on streaming data, a curated dataset that provide 360֯ view of customers… These are all examples of components of the analytic store which facilitate reuse, promote quality consistency and foster innovation.
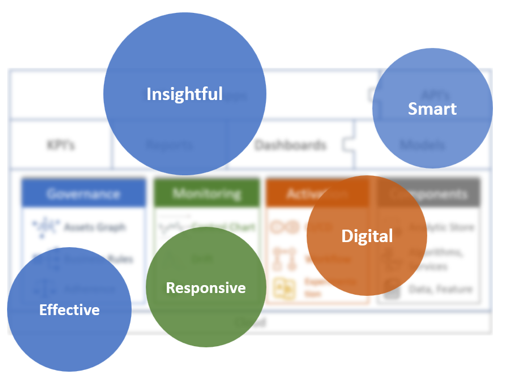
Effective, Responsive, Automatic, Smart and Insightful
To be efficient, nimble and innovative, an enterprise needs all these must-have traits, and different components of the analytic practice as well as other layers of the reference architecture contribute to different traits of a digital enterprise.
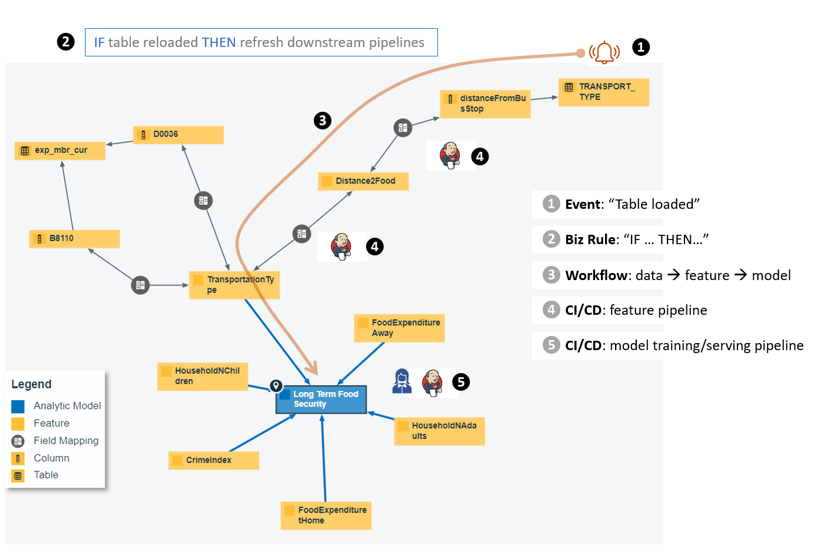
Use case #1, Dynamic behaviors on top of the static assets graph
It takes a village to build an analytic model. Multiple data sources, pipelines for feature engineering, model training and model serving, ad hoc task hyper parameter tuning… It’s already a feast to capture the assets, processes and interdependencies into a knowledge graph, but we can do better! With the help of events, business rules and decisioning as well as activating workflows, we can refresh the model as soon as it has been detected that the underlying distribution of data has drifted.
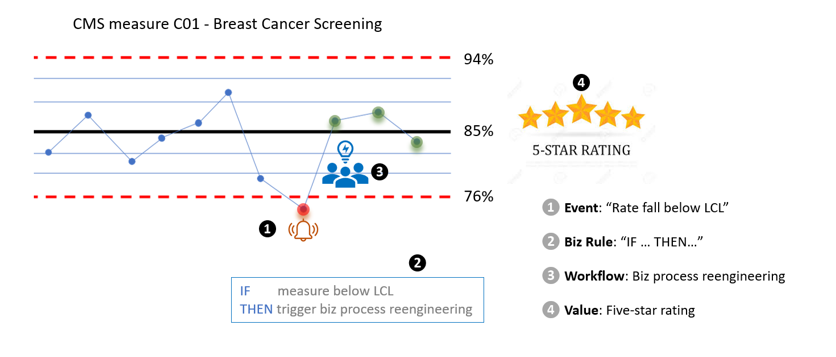
Use Case #2, KPI monitoring
Center for Medicare and Medicaid Services(CMS) is the government agency which defines, measures and reports around 80 health care quality metrics. All insurance providers are required to calculate and report on the set of metrics annually. If you have the SQL or Python code written, why not schedule it to run weekly or daily? Why not monitor the metric and intervene as soon as it dips below the lower control limit?
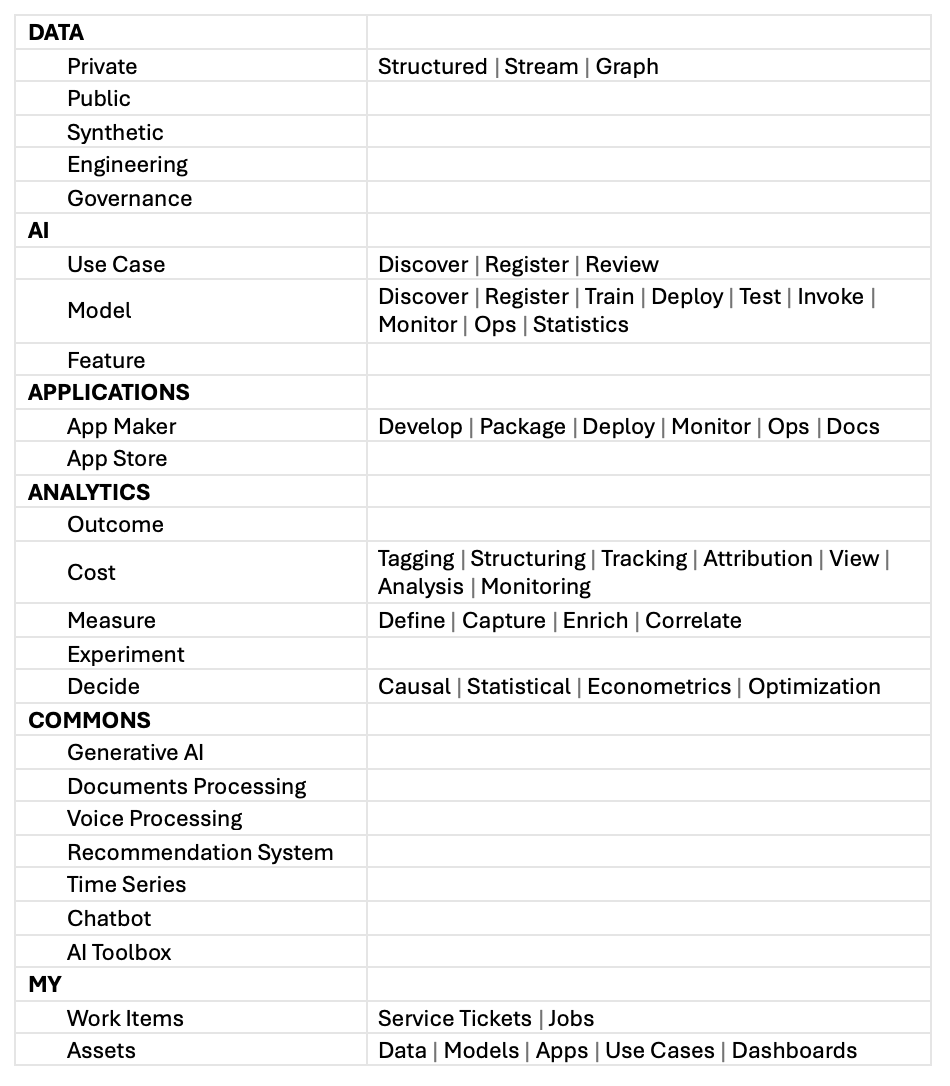
The DnA Portal
The experience layer of the DnA platform may take the form of a portal, which is:
- Structural. The portal reflects the web of AI components, systems, tools and the relationships among them.
- Functional. The portal effectuates AI tasks and processes that facilitate AI practitioners to get things done.
- MLOps and FinOps self-service and automation induce the “highly attentive, low touch” experience.
- Social. The portal connects together AI practitioners across the enterprise, affording discoverability, learning and sharing.
- Communal. The portal collects paved paths and best practices across the enterprise, avoiding duplicative wheel reinventing and empire building.
The structural and functional organization depicted below constitutes the gestalt of enterprise DnA, the organized whole that is more than the sum of its parts. See below for one sample organization of the DnA Portal:
Cloud
The appeal of cloud to enterprises boils down to the simple fact that, as organizations grounded in specific problem domains that’s not hardware or software (analytics being a special software), they don’t want to deal with hardware or software. On public clouds, storage, compute, AI/ML, events, messages, streaming… everything is a service. With these services managed by AWS, the enterprise can focus on what really matters: data, features, knowledge graphs, models…
I saw a small team in a mid-sized enterprise trying to build cloud data science platform from scratch on AWS, ignoring managed services such as AWS/Sagemaker, which totally missed the point of moving to the cloud. Needless to say, the team didn’t succeed and I lost my patients and jumped ship.
Segmentation, commoditization, democratization, and specialization
Because of the XasSification of various components, the analytics ecosystem has been segmented into finely grained granularities. Gone are the days of gigantic appliances or mammoth vertical solutions. If I can quickly stack up a data ingestion service, a SQL query engine and a visualization layer, all being the best-of-class in their respective niche, why do I want to buy so-called BI solution such as Cognos?
Big players often give away tools/components for free to drive adoption of their managed services. In other words, these otherwise lucrative tools/components have been intentionally commoditized.
Fine-grained segmentation lowered the barriers to entry while reducing the efforts for perfection. It’s commonplace nowadays for a single-maintainer to produce a successful tool/component. Segmentation enticed innovation.
Both commoditization and open-source innovation expand accesses, the democratization, of analytics.
All above leave but one option for those who want to sell analytic components/services: specialization. Find a small area which is not yet commoditized or disrupted by open source, offer the best API and services that play well with the rest of the cloud. Conversely, for those who succeeded in specialization, do one thing and do it even better. I’m looking at you Tableau, be the visualization layer that you’re good at, nobody will use you for AI/ML.
Liberalism, conservatism and deep state
I was frustrated seeing data scientists, those kind who know not enough computer science and filled with see-how-deep-is-my-learning hubris, are willing to do only one thing for their CPU and/or memory bound inferencing jobs: “liberally” throwing more and beefier compute instances at their jobs, refusing to do what an “conservative” computer scientist considers must do: profiling, optimizing the flow and reducing the memory footprint of, none other than your own model and inference code!
Since I mentioned liberal and conservative, it’s quite amusing to compare the cloud ecosystem with current day politics.
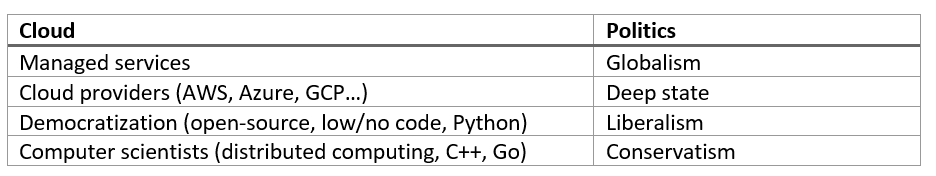
I’m struggling to find the “Trumpism” counterpart in tech: Anti-globalization (tends to do everything inside their walled garden as much as profits permits), appealing more to emotion than reason (high price for what it’s worth), x-supremacy (we’re deh best)… Apple?
Rants and jokes aside, a mature analytics organization strives to play the cloud game smart: Use managed services when it makes sense and curb associates’ tendency of reaching for more storage and compute rather than optimizing their code (welfare vs work).
In Summary
By putting forth the reference cloud native analytic architecture of the digital enterprise, I hope vendors and consumers/practitioners of analytics alike realize the new paradigm of app development that is architecting with managed cloud services, the new opportunities of revamping analytic practices which drive nimble and smart organizational behaviors and the new challenges comes with the new architecture, services and AI/ML technologies.
Reference:
- Law of the tech: commoditize your complement
- Events, Assets graph and Workflow in the enterprise analytic architecture correspond nicely with the episodic, semantic and procedural memory.
- A Comprehensive Guide to Profit and Loss Assessments